Free Access
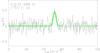
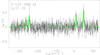
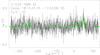
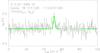
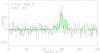
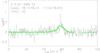
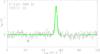
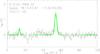
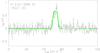
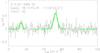
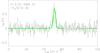
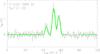
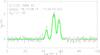
Fig. C.33

Same as Fig. C.1 but towards G13.22−SMM 32. The velocity range for the C2H spectra is wider. Two velocity components are detected in the HCO+ and HNC spectra towards the line emission peaks.
This figure is made of several images, please see below:
Current usage metrics show cumulative count of Article Views (full-text article views including HTML views, PDF and ePub downloads, according to the available data) and Abstracts Views on Vision4Press platform.
Data correspond to usage on the plateform after 2015. The current usage metrics is available 48-96 hours after online publication and is updated daily on week days.
Initial download of the metrics may take a while.