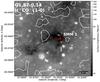
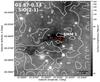
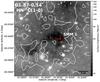
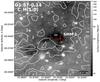
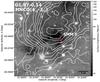
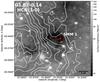
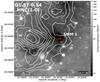
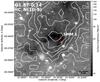
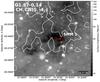
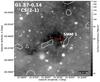
Fig. B.1

Contour maps of integrated intensity of the MALT90 lines detected towards G1.87−SMM 1. In each panel, the contours are overlaid on the arcsinh-scaled Spitzer 8 μm image (cf. Fig. 1). The contour levels start at 3σ for H13CO+, SiO, HN13C, C2H, CH3CN, and 13CS. For HNCO(40, 4 − 30, 3), HCN, HCO+, HNC, HC3N, and N2H+, the contours start at 26σ, 23σ, 20σ, 30σ, 6σ, and 15σ, respectively. In all cases, the contours go in steps of 3σ. The average 1σ value in TMB units is ~ 0.69 K km s-1. The red plus sign marks the LABOCA 870 μm peak position of the clump. A scale bar indicating the 1 pc projected length is indicated. The line emission is extended in many cases, and the HCN, HCO+, and HNC emissions are well correlated with each other. The N2H+ emission also shows some resemblance to these species. The spatial distributions of HNCO and HC3N appear to be similar to each other, while weak CH3CN emission traces reasonably well the 8 μm absorption feature.


Current usage metrics show cumulative count of Article Views (full-text article views including HTML views, PDF and ePub downloads, according to the available data) and Abstracts Views on Vision4Press platform.
Data correspond to usage on the plateform after 2015. The current usage metrics is available 48-96 hours after online publication and is updated daily on week days.
Initial download of the metrics may take a while.