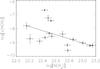
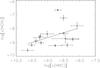
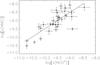
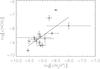
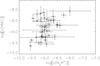
Fig. 2

Top left panel: HCN fractional abundance plotted as a function of H2 column density in logarithmic scales. The rest of the panels show the correlations found between the derived fractional abundances of the molecules. From top right to bottom panel, the panels plot x(HCN) versus x(HNC), x(HNC) versus x(HCO+), x(HCN) versus x(N2H+), and x(HNC) versus x(N2H+) in logarithmic scales. The solid lines show the least squares fit to the data (see text for details).
Current usage metrics show cumulative count of Article Views (full-text article views including HTML views, PDF and ePub downloads, according to the available data) and Abstracts Views on Vision4Press platform.
Data correspond to usage on the plateform after 2015. The current usage metrics is available 48-96 hours after online publication and is updated daily on week days.
Initial download of the metrics may take a while.