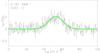
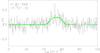
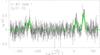
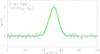
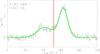
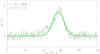
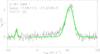
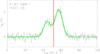
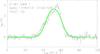
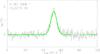
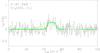
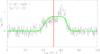
Fig. C.1

Hanning-smoothed spectra towards G1.87−SMM 1. The single-Gaussian and hf structure fits are shown with green lines. The vertical red line plotted on double-peaked profiles indicates the radial velocity of the optically thin HC3N line. The velocity range is wider in the C2H and HCO+ (line emission peak) spectra than in the other panels to show all the detected lines (the additional velocity component is included for the latter).
Current usage metrics show cumulative count of Article Views (full-text article views including HTML views, PDF and ePub downloads, according to the available data) and Abstracts Views on Vision4Press platform.
Data correspond to usage on the plateform after 2015. The current usage metrics is available 48-96 hours after online publication and is updated daily on week days.
Initial download of the metrics may take a while.