Free Access
Fig. 5
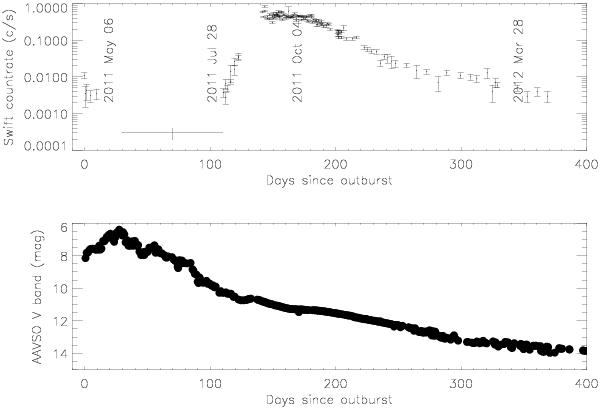
Top: X-ray light curve from Swift/XRT (0.3–10 keV) until day 400 of the 2011 outburst. The first four STIS observations are marked (see Table 1). Bottom: daily averaged AAVSO visual light curve through the outburst.
Current usage metrics show cumulative count of Article Views (full-text article views including HTML views, PDF and ePub downloads, according to the available data) and Abstracts Views on Vision4Press platform.
Data correspond to usage on the plateform after 2015. The current usage metrics is available 48-96 hours after online publication and is updated daily on week days.
Initial download of the metrics may take a while.