Fig. 9
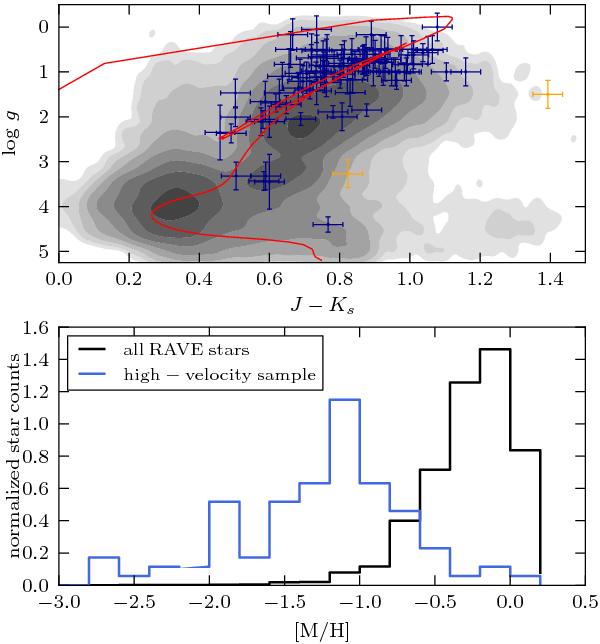
Upper panel: distribution of our high-velocity stars as defined in Fig. 7 in a Hertzsprung-Russell diagram (symbols with blue error bars). For comparison the distribution of all RAVE stars (gray contours) and an isochrone of a stellar population with an age of 10 Gyr and a metallicity of −1 dex (red line) is also shown. The two green symbols represent two stars that were excluded from the samples because of their peculiar locations in this diagram. Lower panel: metallicity distribution of our high-velocity sample (blue histogram). The black histogram shows the metallicity distribution all RAVE stars.
Current usage metrics show cumulative count of Article Views (full-text article views including HTML views, PDF and ePub downloads, according to the available data) and Abstracts Views on Vision4Press platform.
Data correspond to usage on the plateform after 2015. The current usage metrics is available 48-96 hours after online publication and is updated daily on week days.
Initial download of the metrics may take a while.