Fig. 8
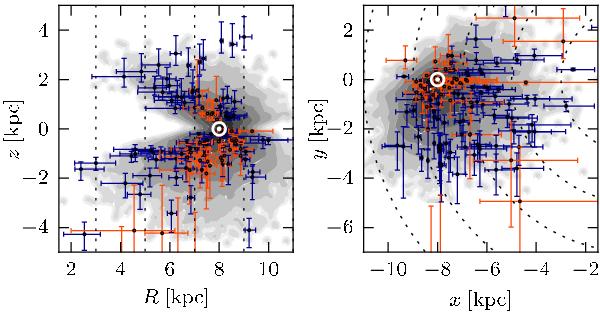
Locations of the stars in our high-velocity sample in the
R-z-plane (left panel) and the
x-y-plane (right panel) as
defined in Fig. 7. Blue and orange symbols
represent RAVE stars and B00 stars, respectively. The error bars show 68% confidence
regions (~1σ). Gray contours show the full RAVE catalog, and the
position of the Sun is marked by a white “⊙”. The dashed lines in both panels mark
locations of constant Galactocentric radius  .
.
Current usage metrics show cumulative count of Article Views (full-text article views including HTML views, PDF and ePub downloads, according to the available data) and Abstracts Views on Vision4Press platform.
Data correspond to usage on the plateform after 2015. The current usage metrics is available 48-96 hours after online publication and is updated daily on week days.
Initial download of the metrics may take a while.