Fig. 6
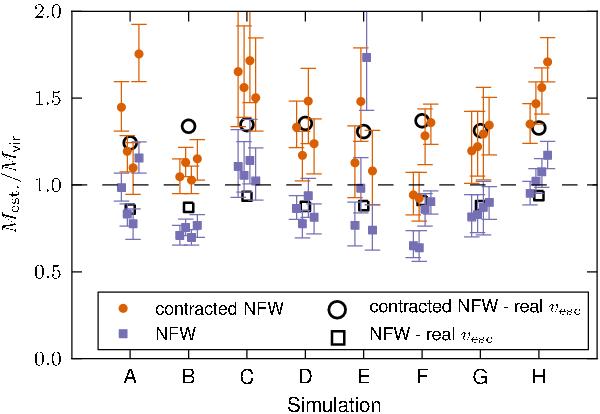
Ratios of the estimated and real virial masses in the eight simulations. For each
simulation, four mass estimates are plotted based on four azimuthal positions of
the Sun in the galaxy. The symbols with error bars represent the estimates based
on the median velocities  obtained
from the error-prone simulation data, while the black symbols show mass estimates
for which the real escape speed was used as input.
obtained
from the error-prone simulation data, while the black symbols show mass estimates
for which the real escape speed was used as input.
Current usage metrics show cumulative count of Article Views (full-text article views including HTML views, PDF and ePub downloads, according to the available data) and Abstracts Views on Vision4Press platform.
Data correspond to usage on the plateform after 2015. The current usage metrics is available 48-96 hours after online publication and is updated daily on week days.
Initial download of the metrics may take a while.