Fig. 2
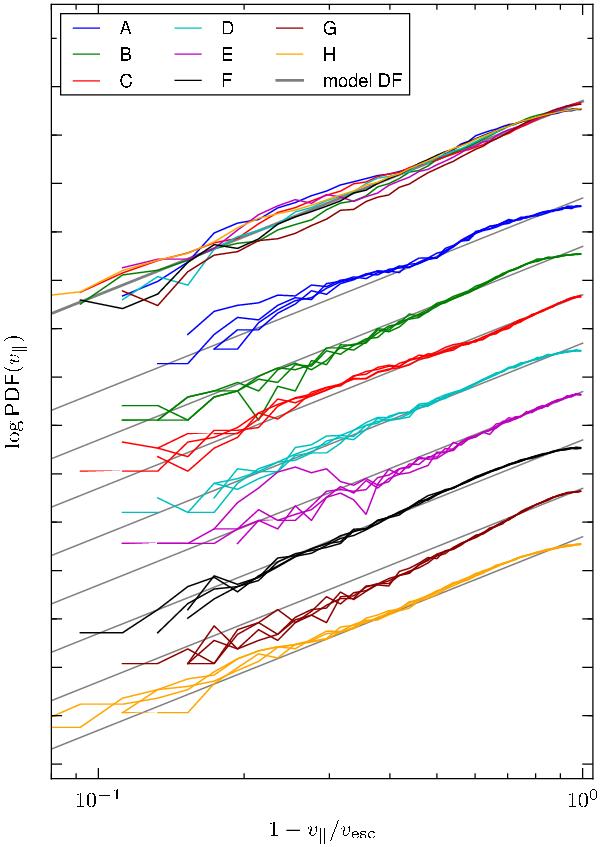
Normalized velocity distributions of the stellar halo population in our eight simulations plotted as a function of 1−ν∥/νesc. Only counter-rotating particles that have Galactocentric distances r between 4 and 12 kpc are considered to select for halo particles (see Sect. 3.1) and to match the volume observed by the RAVE survey. To allow a comparison, each velocity was divided by the escape speed at the particle’s position. Different colors indicate different simulations, and for each simulation the ν∥ distribution is shown for four different observer positions. The top bundle of curves shows the mean of these four distributions for each simulation plotted on top of each other to allow a comparison. The profiles are shifted vertically in the plot for better visibility. The gray lines illustrate Eq. (3) with power-law index k = 3.
Current usage metrics show cumulative count of Article Views (full-text article views including HTML views, PDF and ePub downloads, according to the available data) and Abstracts Views on Vision4Press platform.
Data correspond to usage on the plateform after 2015. The current usage metrics is available 48-96 hours after online publication and is updated daily on week days.
Initial download of the metrics may take a while.