Fig. 13
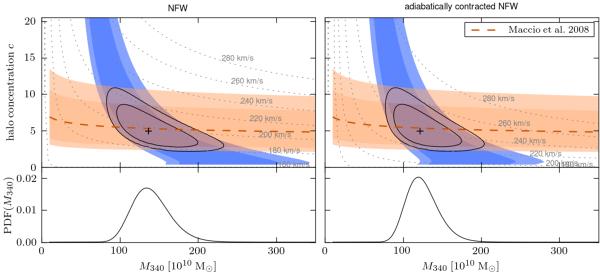
Likelihood distribution resulting from our simple Galaxy model when we leave the halo concentration c (and therefore also VLSR) as a free parameter (blue area) for an NFW profile as halo model (left panel) and an adiabatically contracted NFW profile (right panel). The red contours arise when we add the constraints on c from cosmological simulations: the relation of the mean c for a given halo mass found by Macciò et al. (2008) is represented by the thick dashed orange line. The orange area illustrates the spread around the mean c values found in the simulations. The different shades in the blue and orange colored areas mark locations where the probability dropped to 10%, 1% of the maximum value as do the black contour lines for the combined likelihood distribution. Dotted gray lines connect locations with constant circular speed at the solar radius.
Current usage metrics show cumulative count of Article Views (full-text article views including HTML views, PDF and ePub downloads, according to the available data) and Abstracts Views on Vision4Press platform.
Data correspond to usage on the plateform after 2015. The current usage metrics is available 48-96 hours after online publication and is updated daily on week days.
Initial download of the metrics may take a while.