Fig. 11
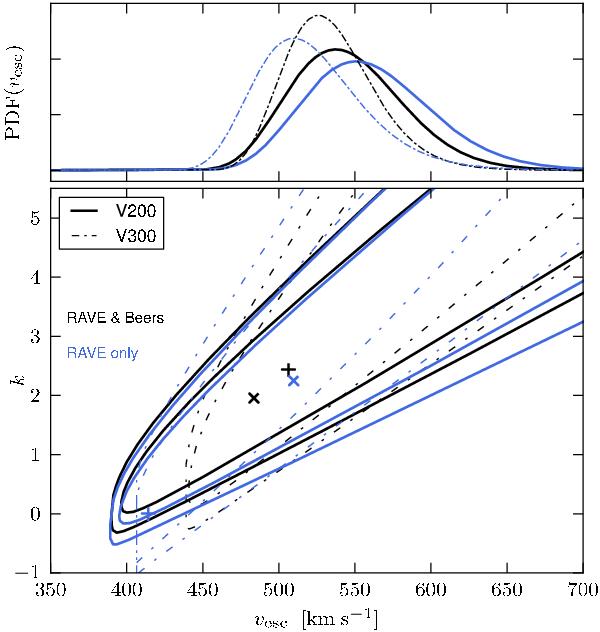
Likelihood distributions of parameter pairs νesc,k (lower panel). The positions of the maximum likelihood pairs are marked with the symbols “×” for the V200 samples and “+” for the V300 samples. Contour lines mark the locations where the likelihood dropped to 10% and 1% of the maximum value. The upper panel shows the likelihood distributions marginalized over the most likely k-interval [2.3, 3.7].
Current usage metrics show cumulative count of Article Views (full-text article views including HTML views, PDF and ePub downloads, according to the available data) and Abstracts Views on Vision4Press platform.
Data correspond to usage on the plateform after 2015. The current usage metrics is available 48-96 hours after online publication and is updated daily on week days.
Initial download of the metrics may take a while.