Fig. 10
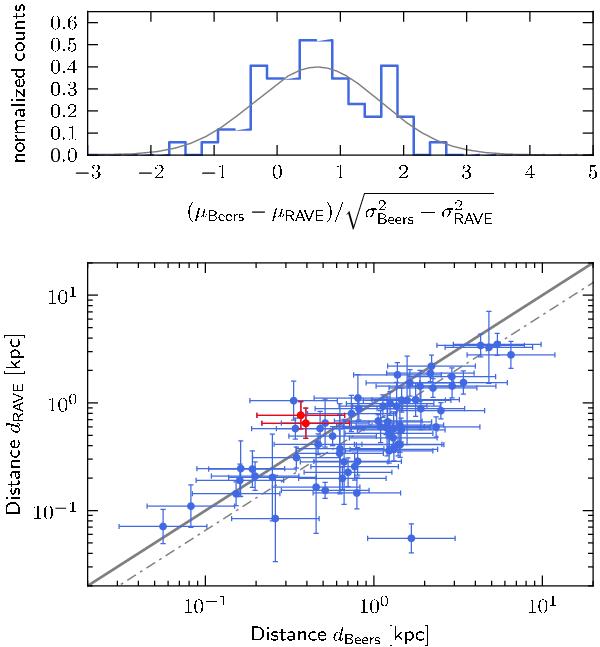
Upper panel: distribution of the differences of the distance modulus estimates, μ, by B00 and Binney et al. (2013), divided by their combined uncertainty for a RAVE-B00 overlap sample of 68 stars. With σBeers = 1.3 mag we find a spread of 1σ in the distribution with the median shifted by 0.6σ ≃ 0.9 mag. The gray curve shows a shifted normal distribution. The two red data points mark two stars which were also entering our high-velocity samples. Lower panel: direct comparison of the two distance estimates with 1 − σ error bars. The solid gray line represents equality, while the dashed-dotted line marks equality after reducing the B00 distances by a factor of 1.5.
Current usage metrics show cumulative count of Article Views (full-text article views including HTML views, PDF and ePub downloads, according to the available data) and Abstracts Views on Vision4Press platform.
Data correspond to usage on the plateform after 2015. The current usage metrics is available 48-96 hours after online publication and is updated daily on week days.
Initial download of the metrics may take a while.