Fig. 3
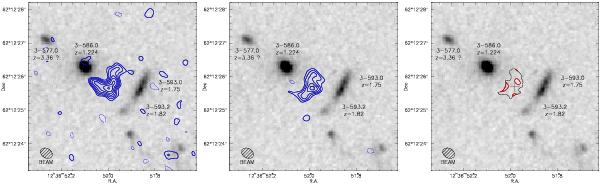
Maps of the velocity-averaged C+ flux density (left), the 0.98mm continuum (middle) and the line-to-continuum ratio (right). The synthesized beam is 0.38′′ × 0.29′′ (lower left of each panel). In these maps, the cross marking the phase reference position, and the background greyscale image, are the same as in Fig. 1. Left panel: the C+ line flux density, in m Jybeam-1, is averaged over the line full width of 940 km s-1. Line contours are −3σ (dashed), + 3σ, and then going up in steps of 1σ = 0.24 m Jybeam-1. The peak is 2.2 m Jybeam-1, and the spatial integral is 9.9 m Jy. Middle panel: the dust continuum was integrated over 2GHz of line-free channels. Continuum contours are −3σ (dashed), + 3σ, and then going up in steps of 1σ = 0.19 m Jy beam-1. The peak continuum emission is 1.4 m Jy beam-1. The spatially-integrated continuum flux density is 4.6 m Jy. Right panel: the line-to-continuum ratio is roughly constant across the map; contour values are 1.0 (black) and 2.0 (red). In these units, the line-to-continuum ratio is dimensionless, and its typical value across the source is 1.5.

Current usage metrics show cumulative count of Article Views (full-text article views including HTML views, PDF and ePub downloads, according to the available data) and Abstracts Views on Vision4Press platform.
Data correspond to usage on the plateform after 2015. The current usage metrics is available 48-96 hours after online publication and is updated daily on week days.
Initial download of the metrics may take a while.