Fig. 2
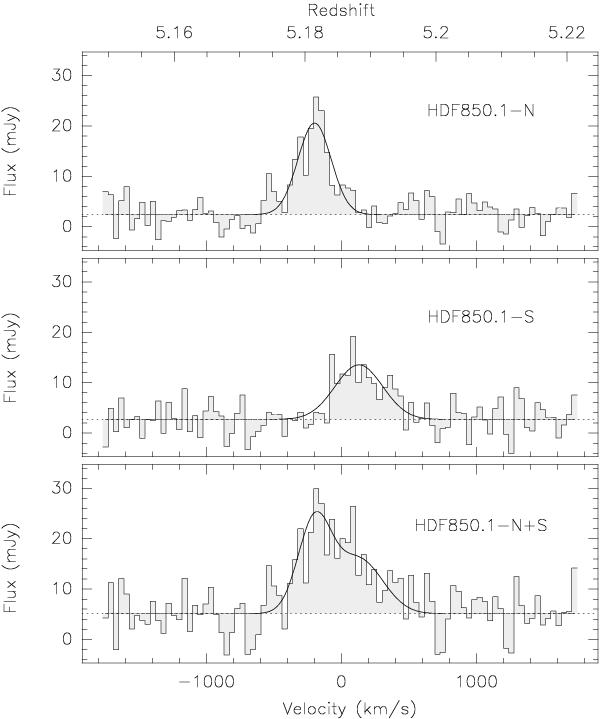
Spatially-integrated spectra of the C+2P P1/2 line, from HDF850.1 north and south (top and middle spectra), and integrated over the entire source (bottom spectrum). The lines are shown above the dust continuum, which is 2.2 m Jy for the north galaxy (top spectrum), 2.4 m Jy for the south galaxy (middle spectrum), and 4.6 m Jy for the whole source (bottom spectrum). Channel widths are 39 km s-1, and velocities are relative to 307.267GHz (C+158 μm at z = 5.1853). The solid curves are Gaussian fits to the line profiles, with a double-Gaussian fit for the entire source (bottom spectrum). The upper horizontal scale shows the range of cosmological redshifts covered by our observing bandwidth. We interpret the spread in line velocities as being due to kinematic motions (lower horizontal scale, in km s-1), not different cosmological redshifts. (These spectra are available as ascii tables at the CDS.)
Current usage metrics show cumulative count of Article Views (full-text article views including HTML views, PDF and ePub downloads, according to the available data) and Abstracts Views on Vision4Press platform.
Data correspond to usage on the plateform after 2015. The current usage metrics is available 48-96 hours after online publication and is updated daily on week days.
Initial download of the metrics may take a while.