Fig. 1
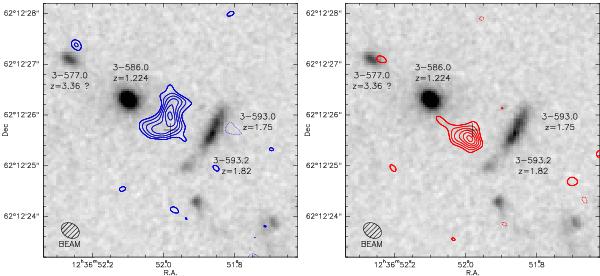
Maps of blueshifted (left) and redshifted (right) C+ emission in HDF850.1, with the 0.98mm continuum subtracted. These two channels are each 470 km s-1 wide, centered on −205 km s-1 and +265 km s-1, with integration ranges of −440 km s-1 to + 30 km s-1 (left) and + 30 km s-1 to + 500 km s-1 (right). These velocities are relative to 307.267GHz (C+158 μm at z = 5.1853). Contours are −3σ (dashed), + 3σ, and then go up in steps of 1σ = 0.20Jybeam-1 km s-1. The blueshifted, C+ north peak (left) is 1.6Jybeam-1 km s-1, and its spatially integrated flux is 6.9Jy km s-1. The redshifted, C+ south peak (right) is 1.4Jybeam-1 km s-1, and its spatially integrated flux is 3.0Jy km s-1. The beam (lower left, in each panel), is 0.38′′ × 0.29′′ at PA = 59° (FWHM), with  KJy-1. The cross marks the phase reference position, at 12:36:51.980, +62:12:25.70 (J2000). The C+-line contours are superimposed on a greyscale version (Downes et al. 1999) of the BVI image from the Hubble Deep Field.
Current usage metrics show cumulative count of Article Views (full-text article views including HTML views, PDF and ePub downloads, according to the available data) and Abstracts Views on Vision4Press platform.
Data correspond to usage on the plateform after 2015. The current usage metrics is available 48-96 hours after online publication and is updated daily on week days.
Initial download of the metrics may take a while.