Free Access
Fig. 8
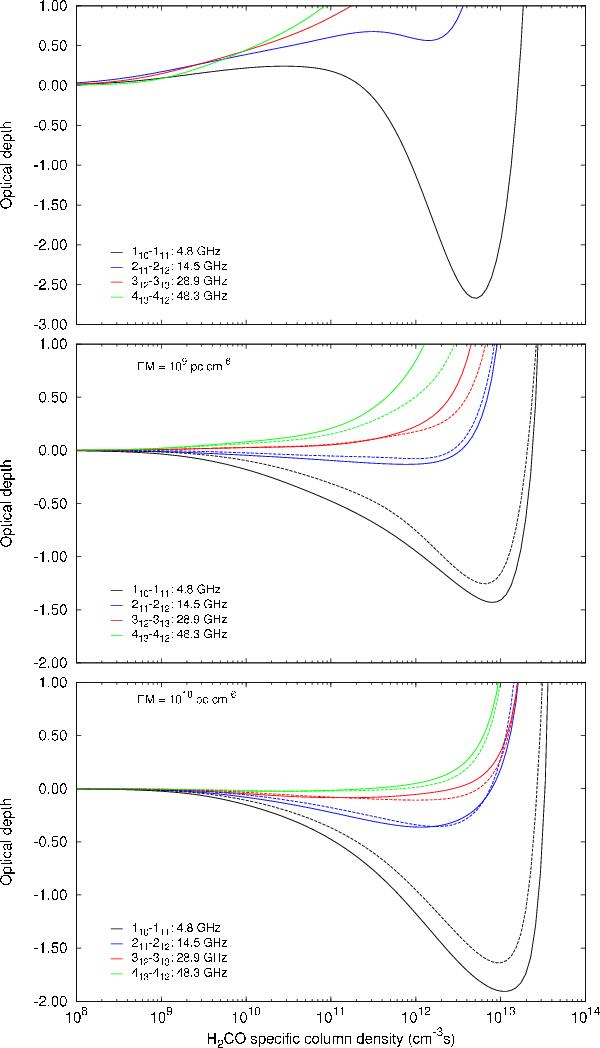
Comparison of optical depths for a number of transitions. The calculations were done for Td = 100 K, Wd = 1.0, and WH ii = 1.0. The solid lines are for Tk = 180 K with nH2 = 1.3 × 105 cm-3 and the dashed lines for Tk = 300 K with nH2 = 4 × 105 cm-3. The emission measure is indicated in each of the panels.
Current usage metrics show cumulative count of Article Views (full-text article views including HTML views, PDF and ePub downloads, according to the available data) and Abstracts Views on Vision4Press platform.
Data correspond to usage on the plateform after 2015. The current usage metrics is available 48-96 hours after online publication and is updated daily on week days.
Initial download of the metrics may take a while.