Fig. 4
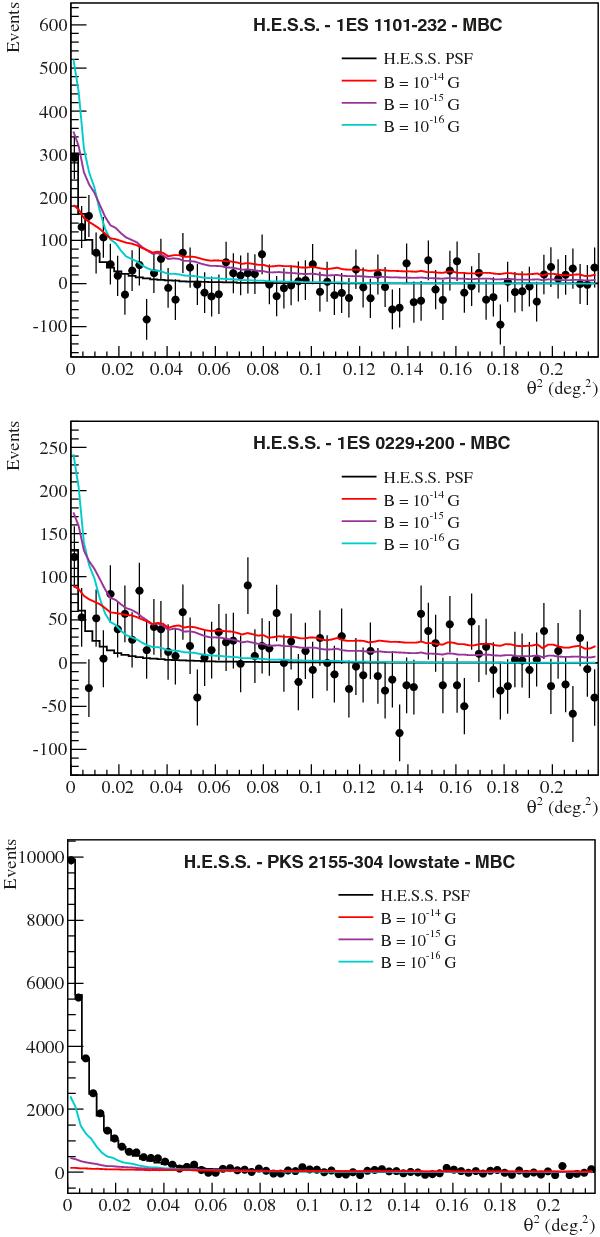
Angular distribution of excess events of 1ES 1101-232 (top), 1ES 0229+200 (middle) and the PKS 2155-304 low state (bottom). The H.E.S.S. data (black points) are plotted against the angular distribution of the MBC model for varying magnetic field strengths. The red, violet, and cyan lines correspond to the maximum cascade flux for magnetic field strengths of 10-14, 10-15 and 10-16 G, simulated under the assumption of the Franceschini et al. (2008) EBL model.
Current usage metrics show cumulative count of Article Views (full-text article views including HTML views, PDF and ePub downloads, according to the available data) and Abstracts Views on Vision4Press platform.
Data correspond to usage on the plateform after 2015. The current usage metrics is available 48-96 hours after online publication and is updated daily on week days.
Initial download of the metrics may take a while.