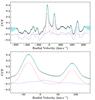
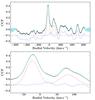
Fig. 8

Example CCFs (black crosses) obtained from FLAMES spectra taken at HJD = 2 455 940.6 (left) and 2 455 979.6 (right), showing the best-fit model (cyan) together with the associated 68.5% confidence interval (light cyan shaded region). The Gaussian and GP terms are also shown separately by the red dot-dashed and blue dashed lines respectively, with a vertical offset added for clarity. The top panel in each case shows the full range used in the fit and the bottom panel a zoom on the region around the peaks.
Current usage metrics show cumulative count of Article Views (full-text article views including HTML views, PDF and ePub downloads, according to the available data) and Abstracts Views on Vision4Press platform.
Data correspond to usage on the plateform after 2015. The current usage metrics is available 48-96 hours after online publication and is updated daily on week days.
Initial download of the metrics may take a while.