Fig. 7
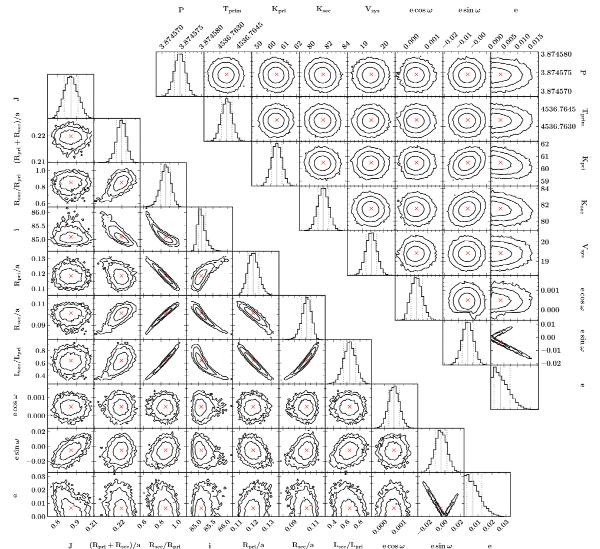
2D contours and 1D histograms of the Monte Carlo chains for selected jktebop parameters (bottom left) and of the MCMC chains for the photometrically constrained radial velocity solution (top right; see Sect. 3.2). On the 2D plots, red crosses show the median values and black contours represent 1, 2 and 3σ confidence intervals. On the histograms, solid and dotted grey vertical lines show the median and ± 1σ intervals, respectively.
Current usage metrics show cumulative count of Article Views (full-text article views including HTML views, PDF and ePub downloads, according to the available data) and Abstracts Views on Vision4Press platform.
Data correspond to usage on the plateform after 2015. The current usage metrics is available 48-96 hours after online publication and is updated daily on week days.
Initial download of the metrics may take a while.