Fig. 6
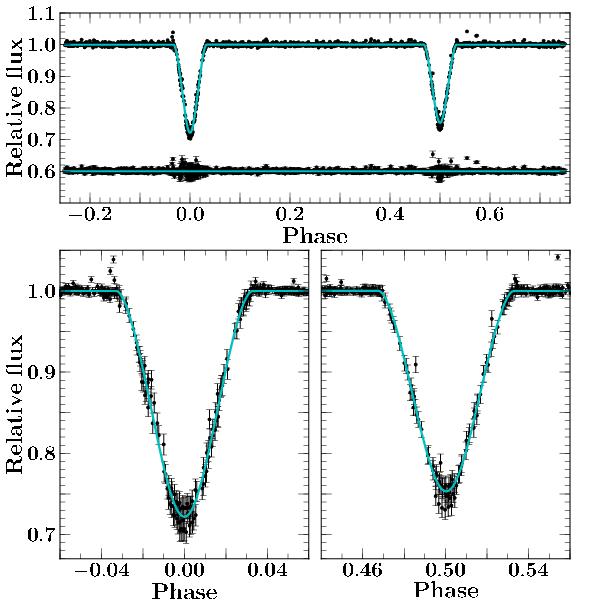
Top: phase folded, detrended CoRoT light curve (black points, 2008 observation) with the jktebop best-fit model shown in cyan. The residuals of the best-fit model are also shown, with a vertical offset for clarity. Phase zero marks the centre of the primary eclipse. The bottom panels show zooms on the primary and secondary eclipses (left and right, respectively).
Current usage metrics show cumulative count of Article Views (full-text article views including HTML views, PDF and ePub downloads, according to the available data) and Abstracts Views on Vision4Press platform.
Data correspond to usage on the plateform after 2015. The current usage metrics is available 48-96 hours after online publication and is updated daily on week days.
Initial download of the metrics may take a while.