Fig. 2
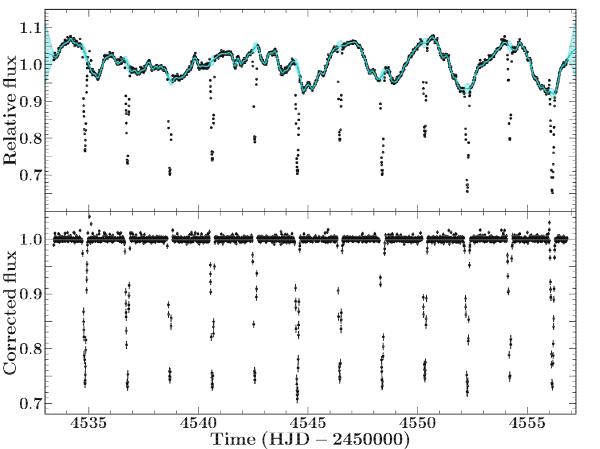
Light curve of CoRoT 223992193 obtained by CoRoT in 2008. The original light curve is shown in black in the top panel. The cyan line and light cyan shaded area show the mean and 95% confidence interval of the predictive distribution of the Gaussian Process used to model the out-of-eclipse variations. The bottom panel shows the light curve after subtracting the mean of the predictive distribution and re-normalising to unity. The detrended light curve, which was used to model the eclipses, has a typical photometric precision of ~ 0.26% per 512 s exposure.
Current usage metrics show cumulative count of Article Views (full-text article views including HTML views, PDF and ePub downloads, according to the available data) and Abstracts Views on Vision4Press platform.
Data correspond to usage on the plateform after 2015. The current usage metrics is available 48-96 hours after online publication and is updated daily on week days.
Initial download of the metrics may take a while.