Fig. 12
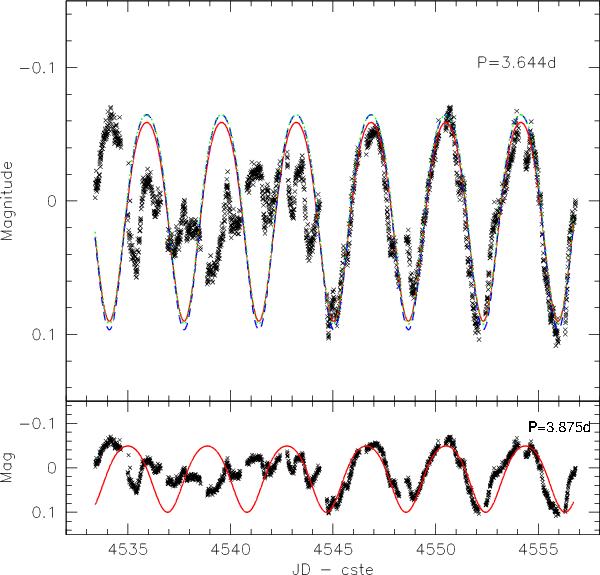
Top: CoRoT 2008 light curve (black crosses) with eclipses removed, showing three versions of our toy spot model (fit to the second half of the light curve only). Red solid line: Tspot = 3000 K, angular radius =55° (fraction of stellar surface covered =0.21) and latitude =70°. Green dotted line: Tspot = 2500 K, angular radius =50° (fraction of stellar surface covered =0.18) and latitude =70°. Blue dashed line: Tspot = 3250 K, angular radius =60° (fraction of stellar surface covered =0.25) and latitude =65°. Bottom: the red spot model with the period set to the binary orbital period (3.875 days).
Current usage metrics show cumulative count of Article Views (full-text article views including HTML views, PDF and ePub downloads, according to the available data) and Abstracts Views on Vision4Press platform.
Data correspond to usage on the plateform after 2015. The current usage metrics is available 48-96 hours after online publication and is updated daily on week days.
Initial download of the metrics may take a while.