Free Access
Fig. 7
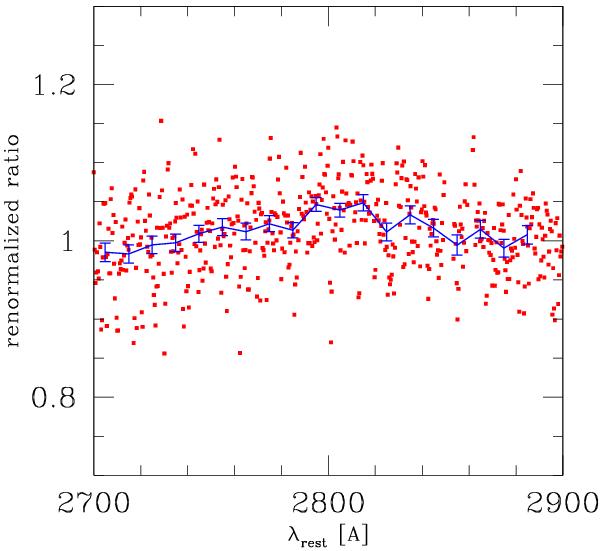
Normalized ratio of the data points from observation 2 to observation 1 (red points: original data; blue line with errorbars: data binned in wavelength by a factor of 30). We removed the points around 2850 Å affected by the imperfect subtraction of the sky emission.
Current usage metrics show cumulative count of Article Views (full-text article views including HTML views, PDF and ePub downloads, according to the available data) and Abstracts Views on Vision4Press platform.
Data correspond to usage on the plateform after 2015. The current usage metrics is available 48-96 hours after online publication and is updated daily on week days.
Initial download of the metrics may take a while.