Fig. 2
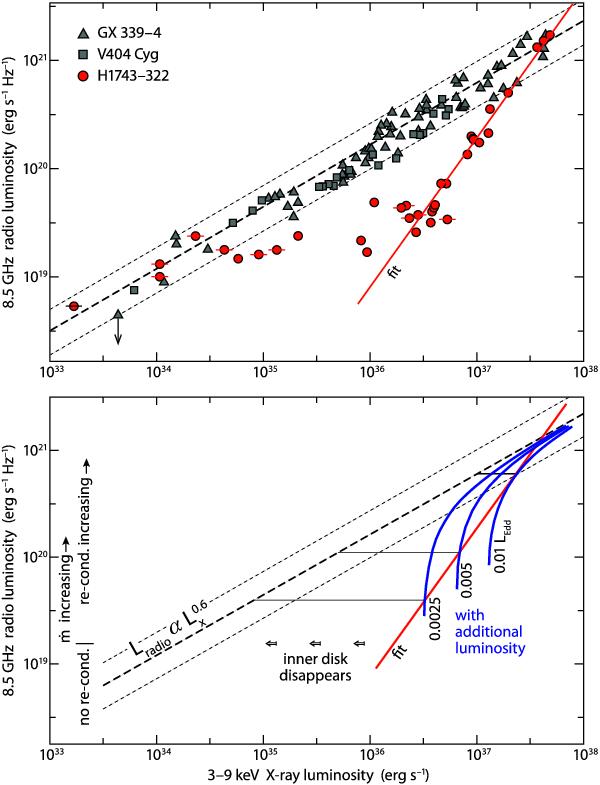
Upper panel: figure adopted from Coriat et al. (2011, Fig. 5): “standard” correlation between radio and X-ray luminosity  , defined by the black hole binaries GX 339-4 and V404 Cyg (dashed lines indicate dispersion) and data for H1743-322, typical of the so-called outliers on the lower track. Red line: fit to the high luminosity data of H1743-322; data for the outburst 2008a marked by horizontal slashes. Lower panel: “standard” correlation between radio and X-ray luminosity and fit to the data for H1743-322 as in upper panel; blue lines: X-ray luminosity including additional luminosity caused by the photons of an underlying disk, ΔLX/LEdd = 0.0025, 0.005 and 0.01); horizontal lines: the increase required for the red line fit to the data of H1743-322.
Current usage metrics show cumulative count of Article Views (full-text article views including HTML views, PDF and ePub downloads, according to the available data) and Abstracts Views on Vision4Press platform.
Data correspond to usage on the plateform after 2015. The current usage metrics is available 48-96 hours after online publication and is updated daily on week days.
Initial download of the metrics may take a while.