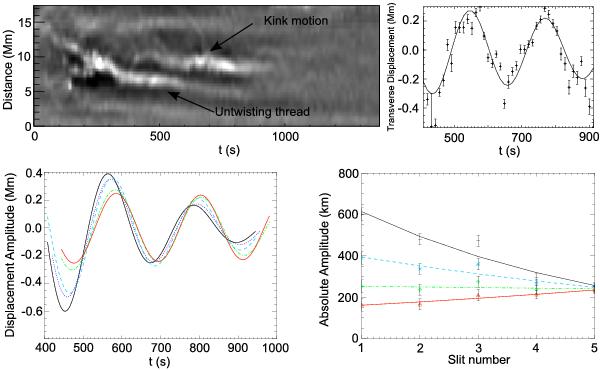
Fig. 6

Upper-left panel: time-distance diagram created using unsharp masked data. The time is in seconds from 21:34:00 UT. Two neighbouring threads of the jet are clearly visible. The observed motion in the lower thread is due to the field line untwisting, while the upper thread supports a transverse MHD wave. Upper-right panel: results from the fitting process. The data points are obtained from a Gaussian fit and the error bars show the total error. The solid line shows the sinusoidal fit to the data points. The data points have been de-trended by subtracting the G(t) term (see Eq. (2)). Lower-left panel: de-trended fits in all slits: slit 1 is solid black, slit 2 is dotted purple, slit 3 is dashed blue, slit 4 is dash-dotted green and slit 5 is triple-dot-dashed red. Bottom-right panel: decrease in amplitude as a function of slit. The amplitudes and sigma errors are plotted along with the exponential fits (lines) for the first minimum (black crosses and solid lines), first maximum (blue stars and dashed line), second minimum (green diamonds and dash-dotted line) and second maximum (red triangles and triple-dot-dashed line).
Current usage metrics show cumulative count of Article Views (full-text article views including HTML views, PDF and ePub downloads, according to the available data) and Abstracts Views on Vision4Press platform.
Data correspond to usage on the plateform after 2015. The current usage metrics is available 48-96 hours after online publication and is updated daily on week days.
Initial download of the metrics may take a while.


