Fig. 5
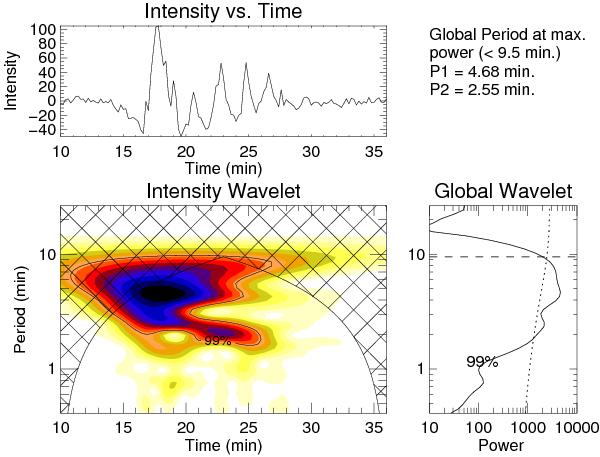
Wavelet result for the quasi-periodic behaviour of the jet outflow events as observed from the AIA 171 Å channel. The top panel shows the background trend removed (12-point running average) intensity variation with time. The bottom-left panel shows the wavelet power spectrum with 99% confidence-level contours, whereas the bottom-right panel shows the global wavelet power spectrum with 99% global confidence level. The periods P1 and P2 at the locations of the first two maxima in the global wavelet spectrum are also shown above the global wavelet spectrum.
Current usage metrics show cumulative count of Article Views (full-text article views including HTML views, PDF and ePub downloads, according to the available data) and Abstracts Views on Vision4Press platform.
Data correspond to usage on the plateform after 2015. The current usage metrics is available 48-96 hours after online publication and is updated daily on week days.
Initial download of the metrics may take a while.