Free Access
Fig. 4
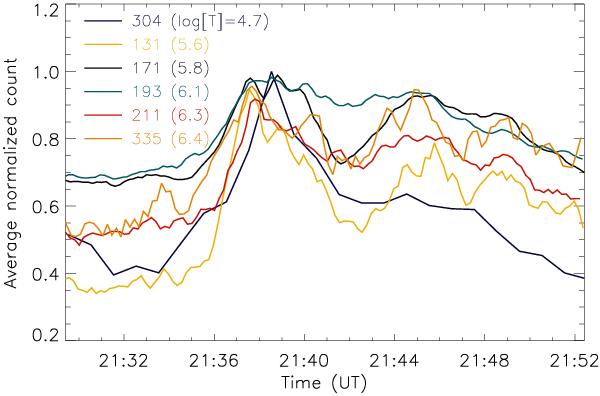
Light curves corresponding to the rectangular box region shown in Fig. 1. The different colours correspond to the different channels as labelled in the figure, along with the peak formation temperatures of the dominant ions in parentheses.
Current usage metrics show cumulative count of Article Views (full-text article views including HTML views, PDF and ePub downloads, according to the available data) and Abstracts Views on Vision4Press platform.
Data correspond to usage on the plateform after 2015. The current usage metrics is available 48-96 hours after online publication and is updated daily on week days.
Initial download of the metrics may take a while.