Fig. 1
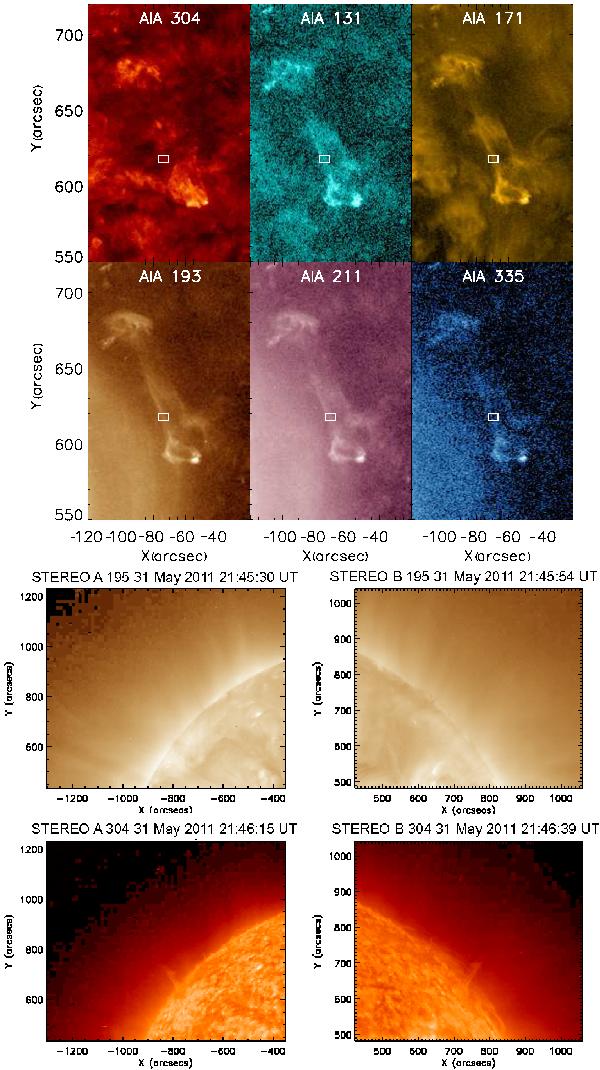
Top panels: SDO/AIA images of the polar coronal hole jet. The wavelength corresponding to each channel is given in the panels. The rectangular box in each frame marks the location of the pixels used to generate the light curves in Fig. 4. Bottom panels: STEREO/SECCHI EUVI images of the same jet. The position of the jet is not obvious in the 195 Å bandpass but can be seen clearly above the limb in 304 Å.
Current usage metrics show cumulative count of Article Views (full-text article views including HTML views, PDF and ePub downloads, according to the available data) and Abstracts Views on Vision4Press platform.
Data correspond to usage on the plateform after 2015. The current usage metrics is available 48-96 hours after online publication and is updated daily on week days.
Initial download of the metrics may take a while.