Fig. 5
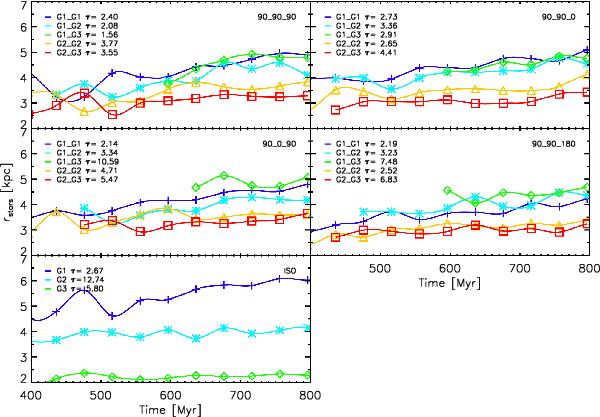
Evolution of the stars disk scalelength in the MIRAGE sample. Each panel traces the evolution of the scalelength for a given orbital configuration, allowing a comparison between mass ratios for a given set of disk orientations at a given specific orbital energy. The measurements are performed every 40 Myr, starting at the time of the core coalescence (400 Myr for the fastest mergers), and each curve linking these measurements is the result of a cubic interpolation to increase the clarity of the plot. The colored lines and different symbols indicate the mass ratio of the progenitors (given by Gi_Gj, see Table 3); the label at the top right of each panel indicates the initial orientation of the disks (given by θ1_θ2_κ, see Table 2). The lower left panel is dedicated to isolated simulations. For each simulation, we indicate the growth time τ expressed in Gyr, which is the time needed for the disk/remnant to double its size starting from the closest measurement to 400 Myr.
Current usage metrics show cumulative count of Article Views (full-text article views including HTML views, PDF and ePub downloads, according to the available data) and Abstracts Views on Vision4Press platform.
Data correspond to usage on the plateform after 2015. The current usage metrics is available 48-96 hours after online publication and is updated daily on week days.
Initial download of the metrics may take a while.