Fig. 2
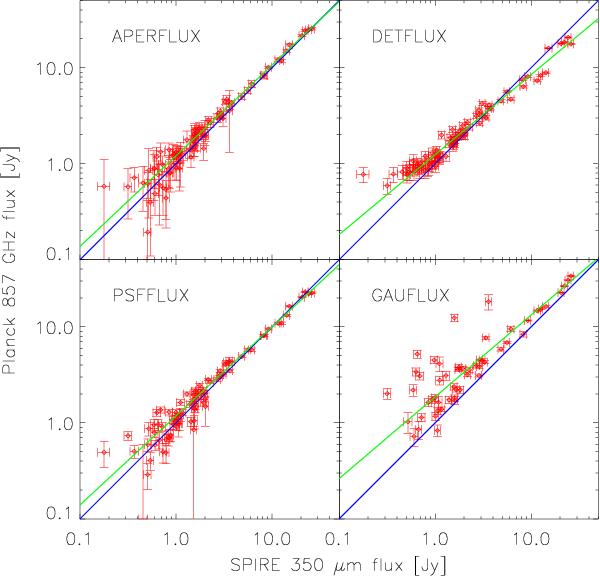
Comparison between the Herschel SPIRE 350 μm flux density and the Planck 857 GHz flux density for the 82 PCCS sources with a clear counterpart. The different panels correspond to four different methods used in the PCCS to measure flux densities. The solid green line represents a linear regression fit to the data, the solid blue line corresponds to a one-to-one correlation. The GAUFLUX panel only contains 53 sources as this flux density estimate is not provided for all sources in the PCCS.
Current usage metrics show cumulative count of Article Views (full-text article views including HTML views, PDF and ePub downloads, according to the available data) and Abstracts Views on Vision4Press platform.
Data correspond to usage on the plateform after 2015. The current usage metrics is available 48-96 hours after online publication and is updated daily on week days.
Initial download of the metrics may take a while.