Free Access
Fig. 3
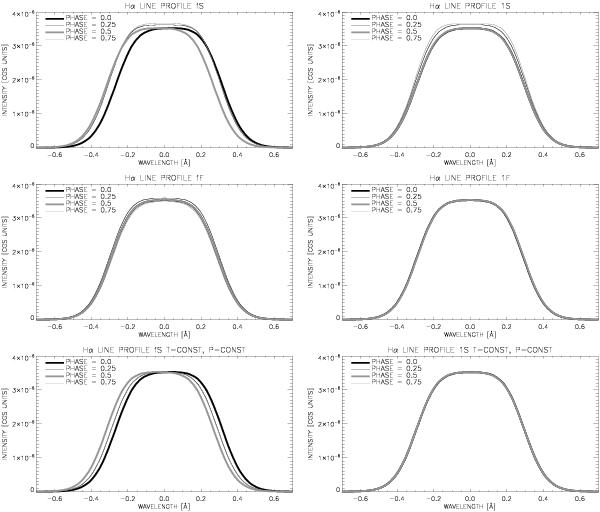
Time variation in the Hα spectral line profile for consecutive phases (labelled in the top left corner of each plot) and different modes. The two bottom plots correspond to modes with vx variations only, where we assumed T = const. and p = const. Specific line intensities are in cgs units erg s-1 cm-2 sr-1 Hz-1.
Current usage metrics show cumulative count of Article Views (full-text article views including HTML views, PDF and ePub downloads, according to the available data) and Abstracts Views on Vision4Press platform.
Data correspond to usage on the plateform after 2015. The current usage metrics is available 48-96 hours after online publication and is updated daily on week days.
Initial download of the metrics may take a while.