Fig. 2
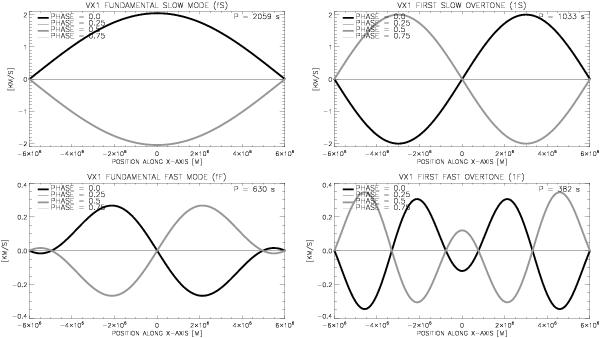
Velocity perturbations along the x-axis of the slab for the fundamental slow mode (fS, top left), the first slow overtone (1S, top right), the fundamental fast mode (fF, bottom left) and the first fast overtone (1F, bottom right). The x-axes of plots are scaled in meters. Note the different velocity scale. Different lines represent different phases (i.e. time divided by period), as labelled at the top left corner of each plot. For phase =0.25 and phase =0.75, the lines are merged. Oscillatory periods are shown at the top right corner of each plot.
Current usage metrics show cumulative count of Article Views (full-text article views including HTML views, PDF and ePub downloads, according to the available data) and Abstracts Views on Vision4Press platform.
Data correspond to usage on the plateform after 2015. The current usage metrics is available 48-96 hours after online publication and is updated daily on week days.
Initial download of the metrics may take a while.