Fig. 11
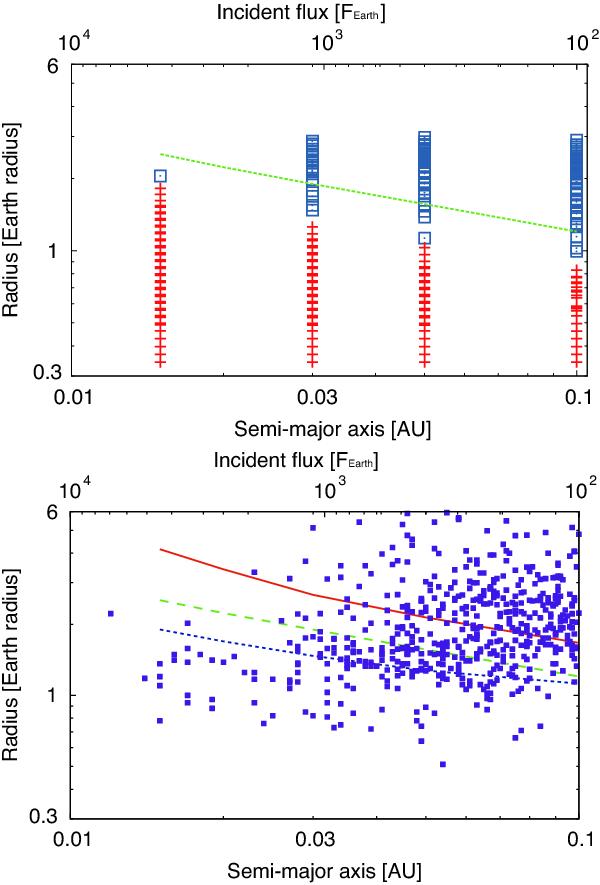
Upper panel: theoretical distribution of radii and semi-major axes
(or incident fluxes) of planets at 10 Gyr with various initial masses and water mass
fractions. Crosses (red) represent planets that lost their water envelopes completely
due to the photo-evaporation in 10 Gyr, while open squares (blue) represent planets
that survive significant loss of the water envelopes. The green line is the minimum
threshold radii,  . Here, we have
adopted ε = 0.1. Lower panel: distribution of radii
and semi-major axes (or incident fluxes) of Kepler planetary
candidates, compared to the threshold radius, (see Sect. 3.3
for definition). We have shown three
. Here, we have
adopted ε = 0.1. Lower panel: distribution of radii
and semi-major axes (or incident fluxes) of Kepler planetary
candidates, compared to the threshold radius, (see Sect. 3.3
for definition). We have shown three  relationships for different
heating efficiencies: ε = 1 (solid red line),
ε = 0.1 (dashed green line), and ε = 0.01 (dotted
blue line). Filled squares represent observational data (http://kepler.nasa.gov, as of June
29, 2013) for planets orbiting host stars with effective temperature of 5300–6000 K
(G-type stars).
relationships for different
heating efficiencies: ε = 1 (solid red line),
ε = 0.1 (dashed green line), and ε = 0.01 (dotted
blue line). Filled squares represent observational data (http://kepler.nasa.gov, as of June
29, 2013) for planets orbiting host stars with effective temperature of 5300–6000 K
(G-type stars).
Current usage metrics show cumulative count of Article Views (full-text article views including HTML views, PDF and ePub downloads, according to the available data) and Abstracts Views on Vision4Press platform.
Data correspond to usage on the plateform after 2015. The current usage metrics is available 48-96 hours after online publication and is updated daily on week days.
Initial download of the metrics may take a while.