Fig. 2
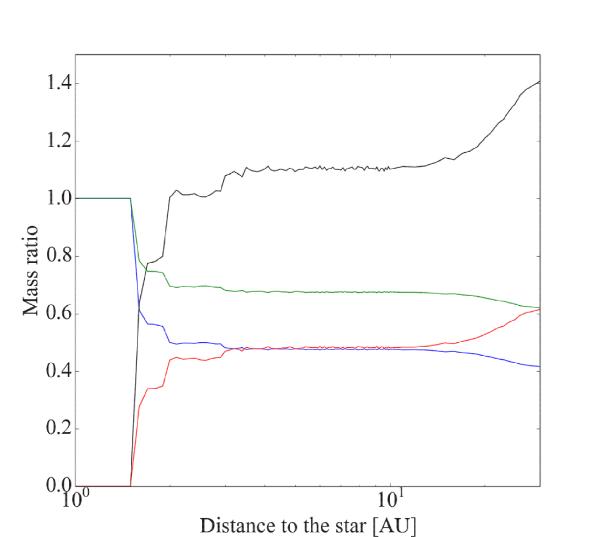
Mass fraction of refractory compounds (rocks) relative to all condensed compounds (organic+inorganic) and ice to rock ratio as a function of distance to the star. This plot is shown for one of the simulated disks with Σ0 = 95.844 g cm-2, acore = 46 AU and γ = 0.9. In blue the rocks mass fraction in the model “without” is plotted; in black, we plot the ices to rocks ratio in the model “without”. In green, we show the same as blue but for model “with”; in red, the same as black but for model “with”.
Current usage metrics show cumulative count of Article Views (full-text article views including HTML views, PDF and ePub downloads, according to the available data) and Abstracts Views on Vision4Press platform.
Data correspond to usage on the plateform after 2015. The current usage metrics is available 48-96 hours after online publication and is updated daily on week days.
Initial download of the metrics may take a while.