Fig. 4
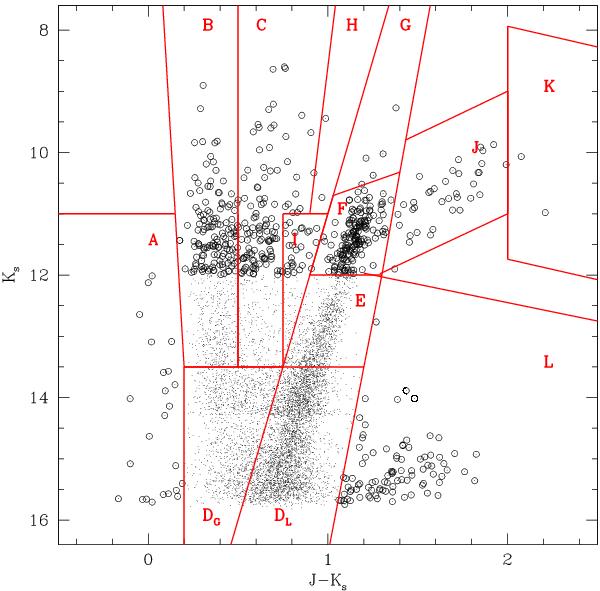
CMD of 2MASS sources positionally matched with the VMC data in tile LMC 8_8. Region boundaries according to Nikolaev & Weinberg (2000) and modified as in Table A.1 to distinguish among different types of stars are indicated. Empty circles identify sources in less crowded regions of the diagram and both regions K and L include sources with (J − Ks) < 5 mag.
Current usage metrics show cumulative count of Article Views (full-text article views including HTML views, PDF and ePub downloads, according to the available data) and Abstracts Views on Vision4Press platform.
Data correspond to usage on the plateform after 2015. The current usage metrics is available 48-96 hours after online publication and is updated daily on week days.
Initial download of the metrics may take a while.