Fig. 8
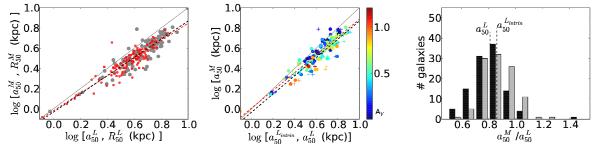
Left: the  (gray points) vs.
  and
and  (red points) vs.
  estimated from the stellar mass integrating the stellar mass surface density profiles. Gray and red dashed lines show the fits. Center: relation between and
  (dots) and
  (cross). color bar codes AV at . Right: distribution of the ratio between half-mass and half-light ratio, corrected (gray bars) and un-corrected (black bars) by extinction. The dashed lines mark the averaged values of the distributions, log /
 (std = 0.07) and log /
  = −0.071 (std = 0.06).
Current usage metrics show cumulative count of Article Views (full-text article views including HTML views, PDF and ePub downloads, according to the available data) and Abstracts Views on Vision4Press platform.
Data correspond to usage on the plateform after 2015. The current usage metrics is available 48-96 hours after online publication and is updated daily on week days.
Initial download of the metrics may take a while.