Fig. 7
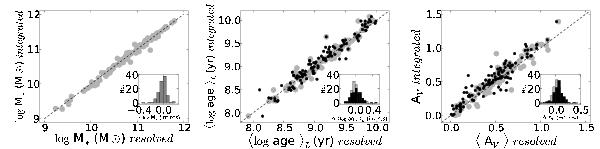
Comparison of the averaged stellar population properties derived from the spatially resolved star formation history and the integrated properties derived from fitting the total galaxy spectrum; left: total stellar mass; center: luminosity weighted age; right: stellar extinction. The histograms in the insets show the distribution of the difference between the integrated and resolved properties. Black dots show the comparison between the integrated property and the value of the property at 1 HLR.
Current usage metrics show cumulative count of Article Views (full-text article views including HTML views, PDF and ePub downloads, according to the available data) and Abstracts Views on Vision4Press platform.
Data correspond to usage on the plateform after 2015. The current usage metrics is available 48-96 hours after online publication and is updated daily on week days.
Initial download of the metrics may take a while.