Fig. 6
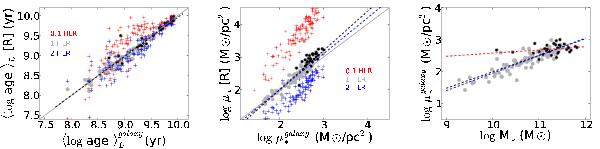
Left: correlation between ⟨log age⟩L at 1 HLR and the galaxy-averaged age  . Black dashed line shows the fit, which is almost equal to the one-to-one line. Black dots mark spheroidal galaxies, C ≥ 2.8. Red and blue plus signs establish the relation between the nuclear (inner 0.1 HLR) and outer disk (2 HLR) ages as a function of
  . Center: correlation between the stellar mass surface density at 1 HLR (gray circles) and
  . Black dashed line shows the fit to all the points, and dashed blue line the fit to the disk galaxies; plus signs like in the left plot. Right: correlation between the galaxy-averaged stellar mass surface density and galaxy stellar mass. Black points are spheroidal galaxies, C ≥ 2.8. The dashed lines show the fits, for disk (blue) dominated galaxies and spheroidals (red). Black dashed line is the fit to all the galaxies.
Current usage metrics show cumulative count of Article Views (full-text article views including HTML views, PDF and ePub downloads, according to the available data) and Abstracts Views on Vision4Press platform.
Data correspond to usage on the plateform after 2015. The current usage metrics is available 48-96 hours after online publication and is updated daily on week days.
Initial download of the metrics may take a while.