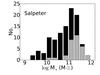
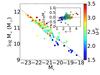
Fig. 5
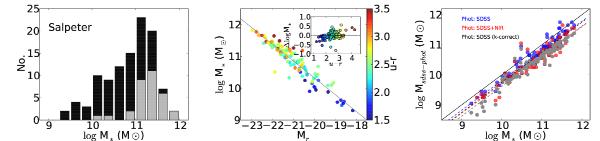
Left: distribution of total stellar masses obtained from the spatially resolved spectral fits of each galaxy. Black bars mark galaxies with C < 2.8, gray bars those with C ≥ 2.8. Center: correlation between the total stellar mass and SDSS r-band total magnitude. Right: comparison of the masses estimated from our analysis (horizontal axis), from SED fitting of integrated SDSS photometry (blue circles), and SDSS+2MASS (red) bands using the code explained in Walcher et al. (in prep.) gray points show the comparison with masses obtained fitting the SDSS photometry with the k-correct routine of Blanton & Roweis (2007). The photo-SED masses are obtained assuming a Chabrier IMF, while the starlight masses are for a Salpeter IMF. The dashed blue, red, and gray lines show the best linear fits, while the solid black line is the one-to-one relation. The dashed black line is the one-to-one relation shifted by 0.25 dex to account for the expected offset due to IMF.
Current usage metrics show cumulative count of Article Views (full-text article views including HTML views, PDF and ePub downloads, according to the available data) and Abstracts Views on Vision4Press platform.
Data correspond to usage on the plateform after 2015. The current usage metrics is available 48-96 hours after online publication and is updated daily on week days.
Initial download of the metrics may take a while.