Fig. 4
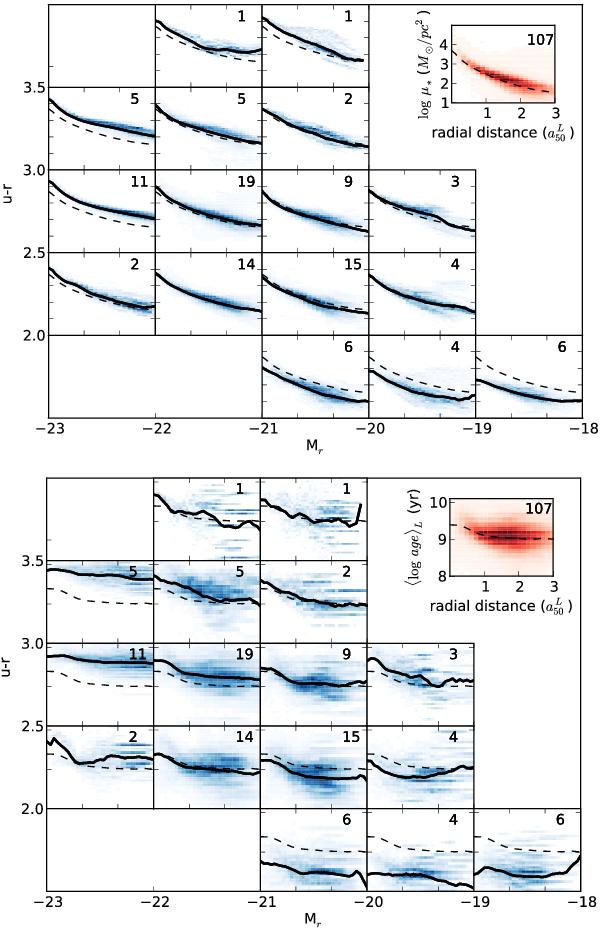
Radial profiles (in units of HLR) of the stellar mass surface density (log μ∗, upper panel), and luminosity weighted mean age, (⟨log age⟩L, bottom panel). Results are stacked in each CMD bin. Individual spaxels are shown in blue, while the mean profile in each CMD box is traced by a solid line. The dashed line is the averaged profile obtained with the 107 galaxies. This profile is also shown in the upper-right inset box that contains the whole spaxel distribution (in red). The number of galaxies in each bin is indicated in each panel.
Current usage metrics show cumulative count of Article Views (full-text article views including HTML views, PDF and ePub downloads, according to the available data) and Abstracts Views on Vision4Press platform.
Data correspond to usage on the plateform after 2015. The current usage metrics is available 48-96 hours after online publication and is updated daily on week days.
Initial download of the metrics may take a while.