Fig. C.1
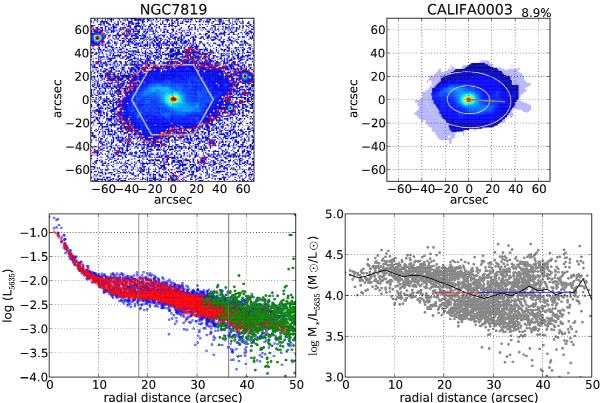
Upper-left panel: r-band SDSS image of NGC 7819 (CALIFA 003); a hexagon indicates the PPaK FoV, and a red contour shows the 1σ background. Upper-right panel: CALIFA image at 5635 Å; light blue shows the area of the galaxy outside the PPaK FoV, taken as that enclosed within the red contour in the left image minus the CALIFA image. The ellipses show the positions of 1 HLR and 2 HLR ( ), and the gray line shows
  . Bottom-left panel: (blue points) SDSS r-band surface brightness profiles scaled to (red points) CALIFA surface brightness profiles at 5635 Å; the green points are those red points that fall outside PPaK FoV, and are the ones used for the computation of the missing stellar mass. The position of 1 HLR and 2 HLR are marked by vertical lines. Bottom-right panel: mass-luminosity ratio derived from our spectral fits obtained pixel to pixel (gray points) and the averaged radial profile (black line). Horizontal lines are the mass-to-luminosity ratio averaged for points that are between 1 and 2 HLR (red) and 1.5−2.5 HLR (blue).
Current usage metrics show cumulative count of Article Views (full-text article views including HTML views, PDF and ePub downloads, according to the available data) and Abstracts Views on Vision4Press platform.
Data correspond to usage on the plateform after 2015. The current usage metrics is available 48-96 hours after online publication and is updated daily on week days.
Initial download of the metrics may take a while.