Fig. 2
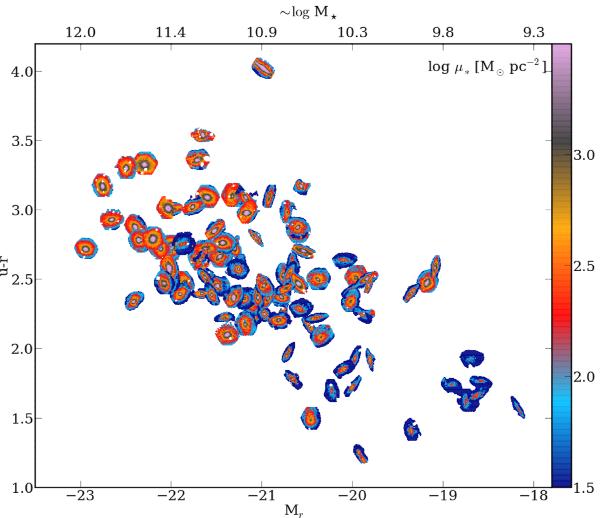
2D maps of the stellar mass density μ∗. Each galaxy is placed in its location in the u − r vs. Mr diagram, where color and magnitude correspond to its global values. The stellar mass corresponding to Mr is shown in the top horizontal axis, following the fit log M∗ = −0.45 − 0.54Mr (Fig. 5b). The 2D maps are shown with north up and east to the left.
Current usage metrics show cumulative count of Article Views (full-text article views including HTML views, PDF and ePub downloads, according to the available data) and Abstracts Views on Vision4Press platform.
Data correspond to usage on the plateform after 2015. The current usage metrics is available 48-96 hours after online publication and is updated daily on week days.
Initial download of the metrics may take a while.