Fig. B.2
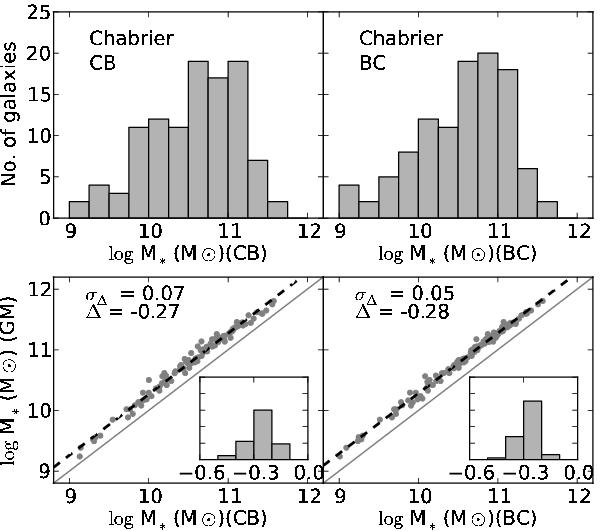
The galaxy stellar mass distributions obtained from the spatially resolved star formation history. The histograms show the results obtained with the bases GM, CB, and BC, from left to right, upper panels. The lower panels show the comparison of the galaxy stellar mass obtained with GM (vertical axis) and CB or BC (horizontal axis) for the 107 CALIFA galaxies. A one-to-one line is drawn in all the panels, as well as the best fit (dashed lines). The histogram inserted in each panel shows the differences in the log M∗ obtained with the base CB or BC with respect to GM. In the top-left corner of the panel, Δ is defined as CB – GM or BC – GM, and their dispersions are labeled.
Current usage metrics show cumulative count of Article Views (full-text article views including HTML views, PDF and ePub downloads, according to the available data) and Abstracts Views on Vision4Press platform.
Data correspond to usage on the plateform after 2015. The current usage metrics is available 48-96 hours after online publication and is updated daily on week days.
Initial download of the metrics may take a while.