Fig. 14
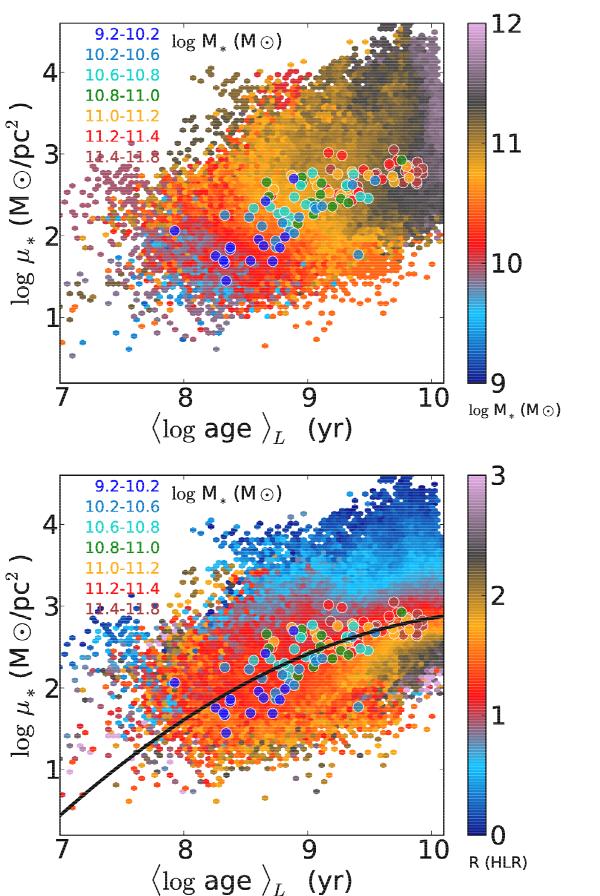
Stellar mass surface density − age relationship for all of the 98 291 individual zones in the 107 galaxies. Small points are color coded by the stellar mass of the galaxy to which they belong (upper panel) and by the distance of each zone to the nucleus of the galaxy in units of HLR (bottom panel). The circles are color coded by galaxy mass and represent the global  and ⟨log age
 relation. The line in the bottom panel shows the result of a second-order polynomial fit.
Current usage metrics show cumulative count of Article Views (full-text article views including HTML views, PDF and ePub downloads, according to the available data) and Abstracts Views on Vision4Press platform.
Data correspond to usage on the plateform after 2015. The current usage metrics is available 48-96 hours after online publication and is updated daily on week days.
Initial download of the metrics may take a while.