Fig. 12
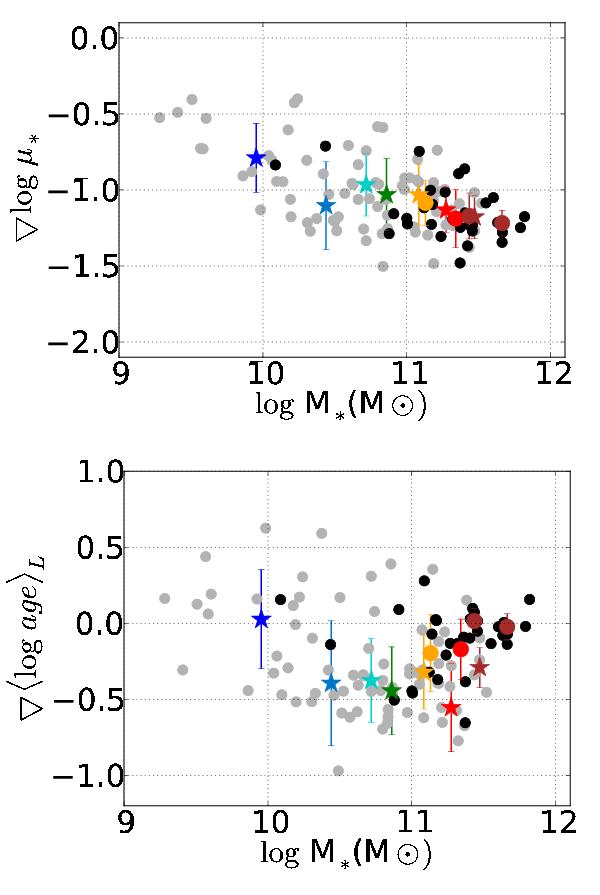
Correlation between the inner gradient (calculated between the galaxy nucleus and at HLR) of log μ∗ (upper panel) and ages (bottom panel) and galaxy stellar mass. Black and gray points are galaxies with concentration index above (early-type galaxies) and below (late-type galaxies) 2.8, respectively. Median gradient value for different mass bins (log M∗ (M⊙) = 9.2−10.2, 10.2−10.6, 10.6−10.8, 10.8−11.0, 11.0−11.2, 11.2−11.4, 11.4−11.6, and 11.6−12.0) for early-type galaxies (dots) and late-type galaxies (stars) are shown. Stars and large colored dots are located at the mean value of log M∗ of the galaxies that belong to the corresponding mass bin.
Current usage metrics show cumulative count of Article Views (full-text article views including HTML views, PDF and ePub downloads, according to the available data) and Abstracts Views on Vision4Press platform.
Data correspond to usage on the plateform after 2015. The current usage metrics is available 48-96 hours after online publication and is updated daily on week days.
Initial download of the metrics may take a while.