Fig. 11
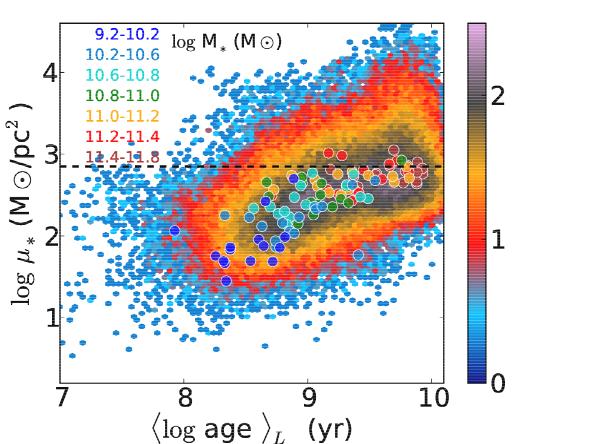
The stellar mass surface density − age relationship resulting from fitting the 98291 spectra of 107 galaxies. The color bar shows the density of spectra per plotted point (red-orange are a few tens of spectra). Also plotted (as larger circles) are the averaged values for each galaxy, obtained as explained in Sect. 6. The colors of these circles code the galaxy mass (orange-red are galaxies more massive than 1011 M⊙); the dashed line marks μ∗ = 7 × 10² M⊙/pc2.
Current usage metrics show cumulative count of Article Views (full-text article views including HTML views, PDF and ePub downloads, according to the available data) and Abstracts Views on Vision4Press platform.
Data correspond to usage on the plateform after 2015. The current usage metrics is available 48-96 hours after online publication and is updated daily on week days.
Initial download of the metrics may take a while.