Fig. 10
Relation between  /
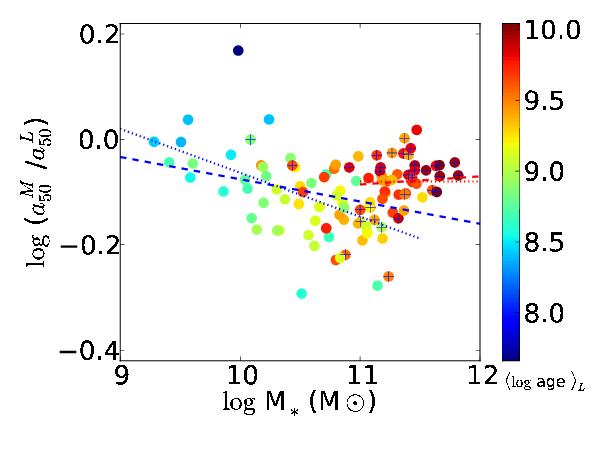
/ and the total stellar mass. Points are colored according to the luminosity weighted age of the stellar population at
  . Galaxies with concentration index C ≥ 2.8 are marked with a cross. Dashed blue line shows the fit for all the galaxies with log M∗ (M⊙) ≤ 11, dashed red for log M∗ (M⊙) > 11, and dotted blue and red lines are the fit for disk dominated galaxies and spheroidal galaxies, respectively.
Current usage metrics show cumulative count of Article Views (full-text article views including HTML views, PDF and ePub downloads, according to the available data) and Abstracts Views on Vision4Press platform.
Data correspond to usage on the plateform after 2015. The current usage metrics is available 48-96 hours after online publication and is updated daily on week days.
Initial download of the metrics may take a while.