Fig. 1
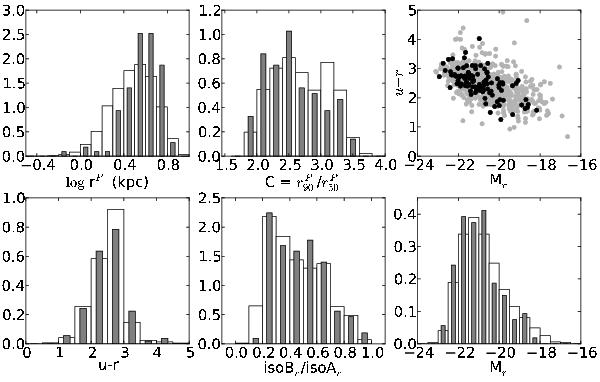
Comparison of the distributions of the CALIFA mother sample (empty bars) and the 107 galaxies analyzed here (filled bars). From bottom up, and from left to right, we show the distributions of: u − r color, the ratio between the semi-minor and semi-major axis, the absolute magnitude, the Petrosian 50% radius,  , and the concentration index (measured at the SDSS r band). The histograms are normalized to form a probability density, i.e. each bar scales with the ratio of the number of galaxies in each bin and the total number of galaxies × bin width, so that we can directly compare the two distributions. The upper-right panel shows the CMD where galaxies of the mother sample are the gray points and the 107 galaxies analyzed here are marked as black points.
Current usage metrics show cumulative count of Article Views (full-text article views including HTML views, PDF and ePub downloads, according to the available data) and Abstracts Views on Vision4Press platform.
Data correspond to usage on the plateform after 2015. The current usage metrics is available 48-96 hours after online publication and is updated daily on week days.
Initial download of the metrics may take a while.