Free Access
Fig. 6
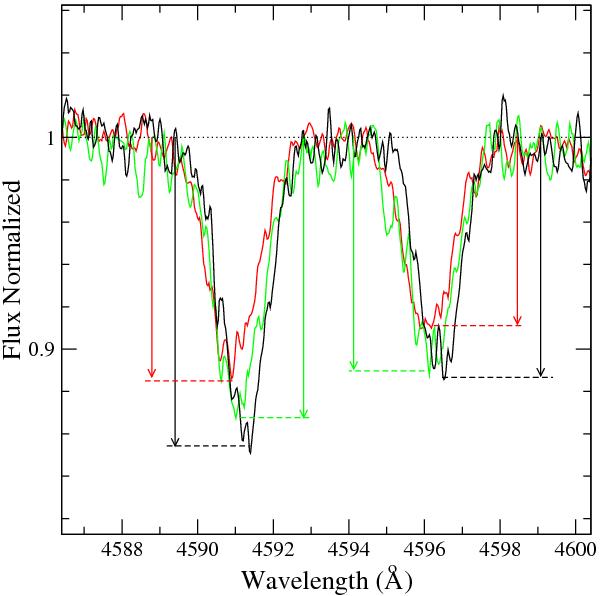
Variability in the line profiles of two of the features used for the cross correlation, O ii 4591 and 4596 Å. The red line is spectrum 1, the green line is spectrum 3, and the black line is spectrum 5. The variations in line depth (indicated by the arrows) are typical of pulsating supergiants.
Current usage metrics show cumulative count of Article Views (full-text article views including HTML views, PDF and ePub downloads, according to the available data) and Abstracts Views on Vision4Press platform.
Data correspond to usage on the plateform after 2015. The current usage metrics is available 48-96 hours after online publication and is updated daily on week days.
Initial download of the metrics may take a while.