Free Access
Fig. 5
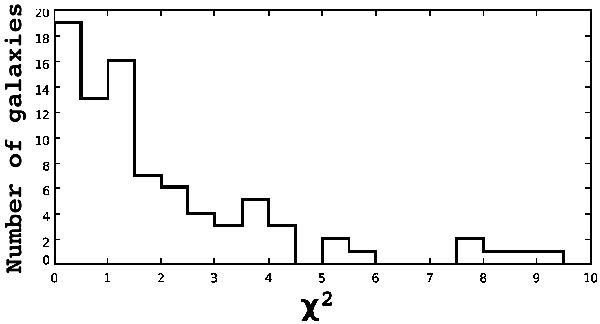
The distribution of the  values obtained from the Bayesian analysis of 95 galaxies with known spectroscopic redshifts that were used for SED fitting. Eleven galaxies with larger than 10 are not shown in this plot. For 32 galaxies is lower than 1, with mean and a median value equal to 0.42.
Current usage metrics show cumulative count of Article Views (full-text article views including HTML views, PDF and ePub downloads, according to the available data) and Abstracts Views on Vision4Press platform.
Data correspond to usage on the plateform after 2015. The current usage metrics is available 48-96 hours after online publication and is updated daily on week days.
Initial download of the metrics may take a while.